US Election 2024 Web Monitor
In a year with many high-profile elections around the globe, none is keeping international audiences on the edges of their seats like the US Presidential Election 2024. After the Democratic Convention in August in August, both candidates and their running mates were officially confirmed.
As Kamala Harris faces off against Donald Trump, which way will the pendulum swing? And how can you measure the impact of online media on public opinion and the perception of events?
Visual Analytics Dashboard for the US Election 2024
Now that the final sprint to Election Day begins, a team of European researchers aims to replace the guesswork with automated knowledge extraction. The team, led by webLyzard technology, has just launched its free US Election 2024 Web Monitor, a powerful tool to track the public debate and the candidates’ performance on the campaign trail. Real-time analyses of online coverage based on the webLyzard Web intelligence platform reveal opinion leaders, shed light on events that impact the coverage, and help compare stakeholder perceptions.
Try out the dashboard at us2024.weblyzard.com
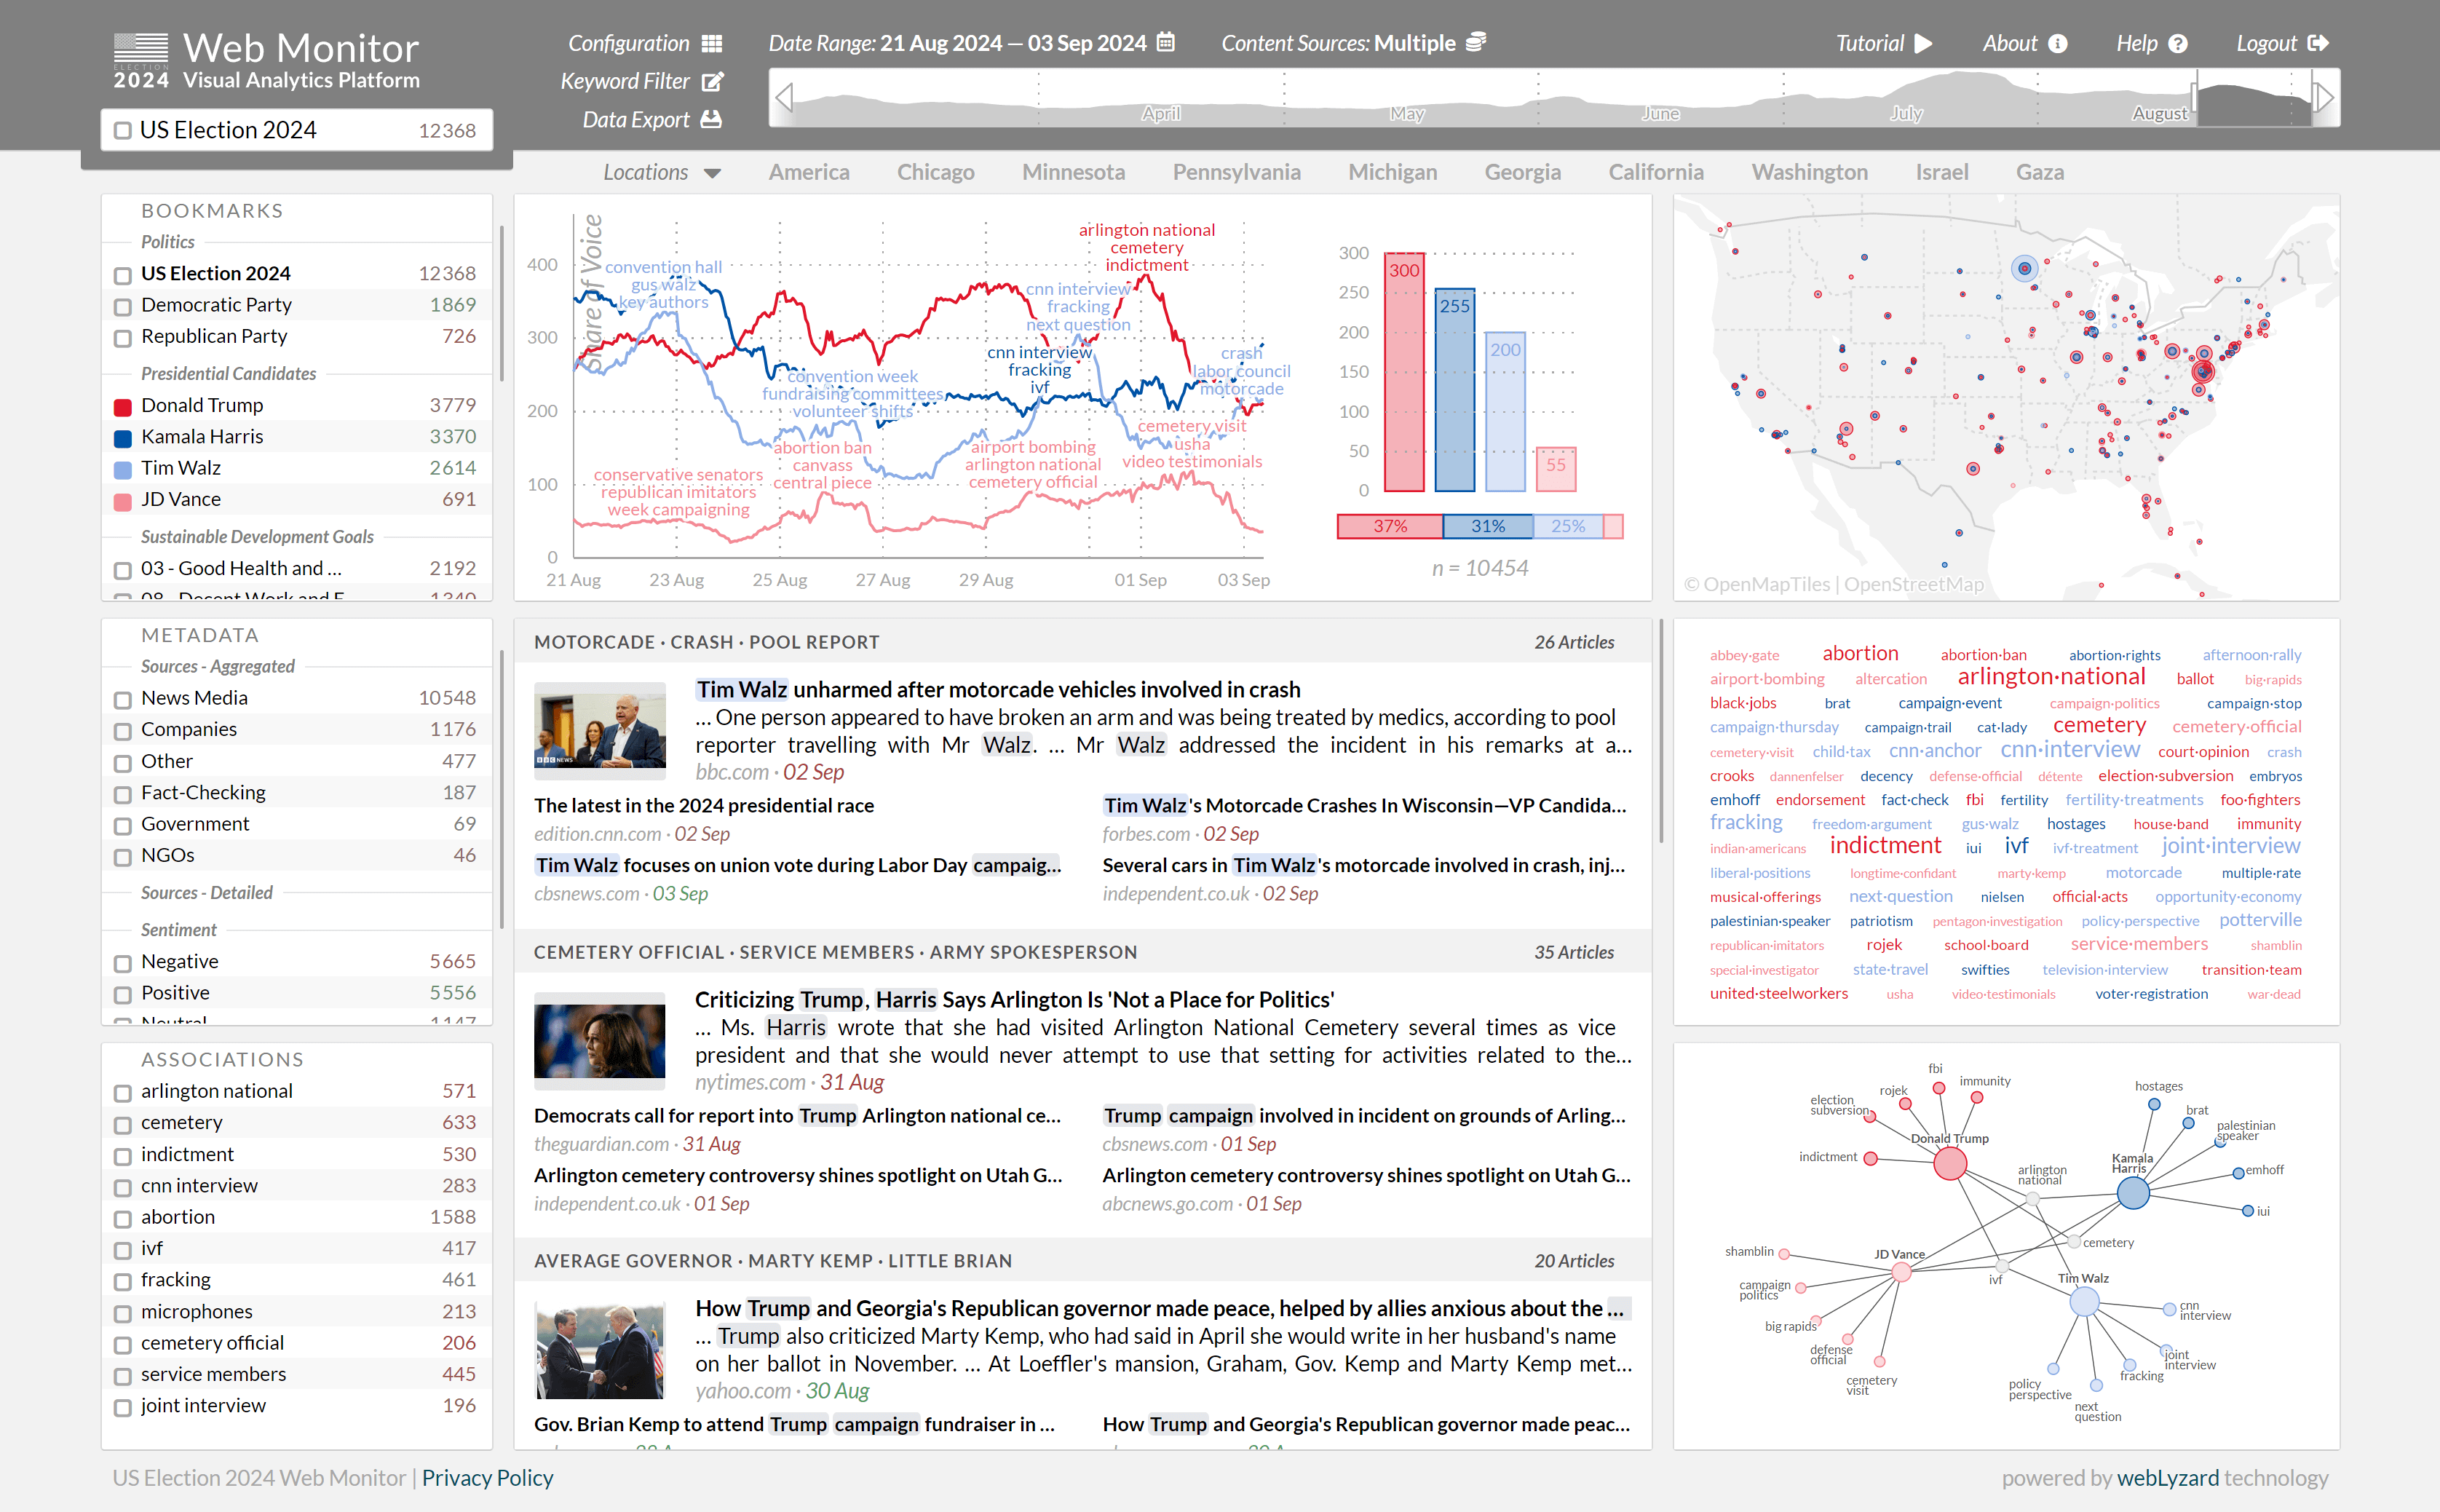
Designed to aid researchers, journalists, and members of the public, the dashboard offers a wide range of visual tools – see the screenshot below for a few example analyses, and the dashboard tutorials for additional information on how to use the platform:
- Trend Detection: Where does the public debate go? How do daily events influence public opinion and the coverage of specific candidates and issues?
- Geographic Map: What is the regional focus of conversations, from where do they originate and how do they spread?
- Tag Clouds and Keyword Graphs to reveal candidate associations. Where do they stand on global issues like climate change, environmental protection, the economy, or geopolitics? Enter a topic of your choice to discover how candidates are associated with the subject and what they say about it.
The Mission: Transparency and Sustainability
The US Election 2024 Web Monitor is being made available to the public as an accurate and evidence-based analytics tool that offers real-time insights into the global debate. The goal is not to predict the election’s outcome, but to reveal and better understand prevalent campaign topics, and to find out who can claim opinion leadership for these topics.
Capture Stakeholder Communication
In recent years, we observe a trend towards an increasingly polarized electorate. Heated online discussions reflect the prevalence of filter bubbles and echo chambers in the global debate. Web intelligence technologies are uniquely positioned to study such phenomena.
To detect such polarized coverage and increase transparency, each week we capture and process about 200,000 documents to generate various analyses and visualizations. To properly reflect the different stakeholders, this includes content from the Websites of news and fact checking organizations, companies, NGOs and the public sector (federal agencies, municipalities, etc.). About 10,000 of these documents make direct references to the upcoming election and at least one of the presidential candidates.
Identify Opinion Leaders
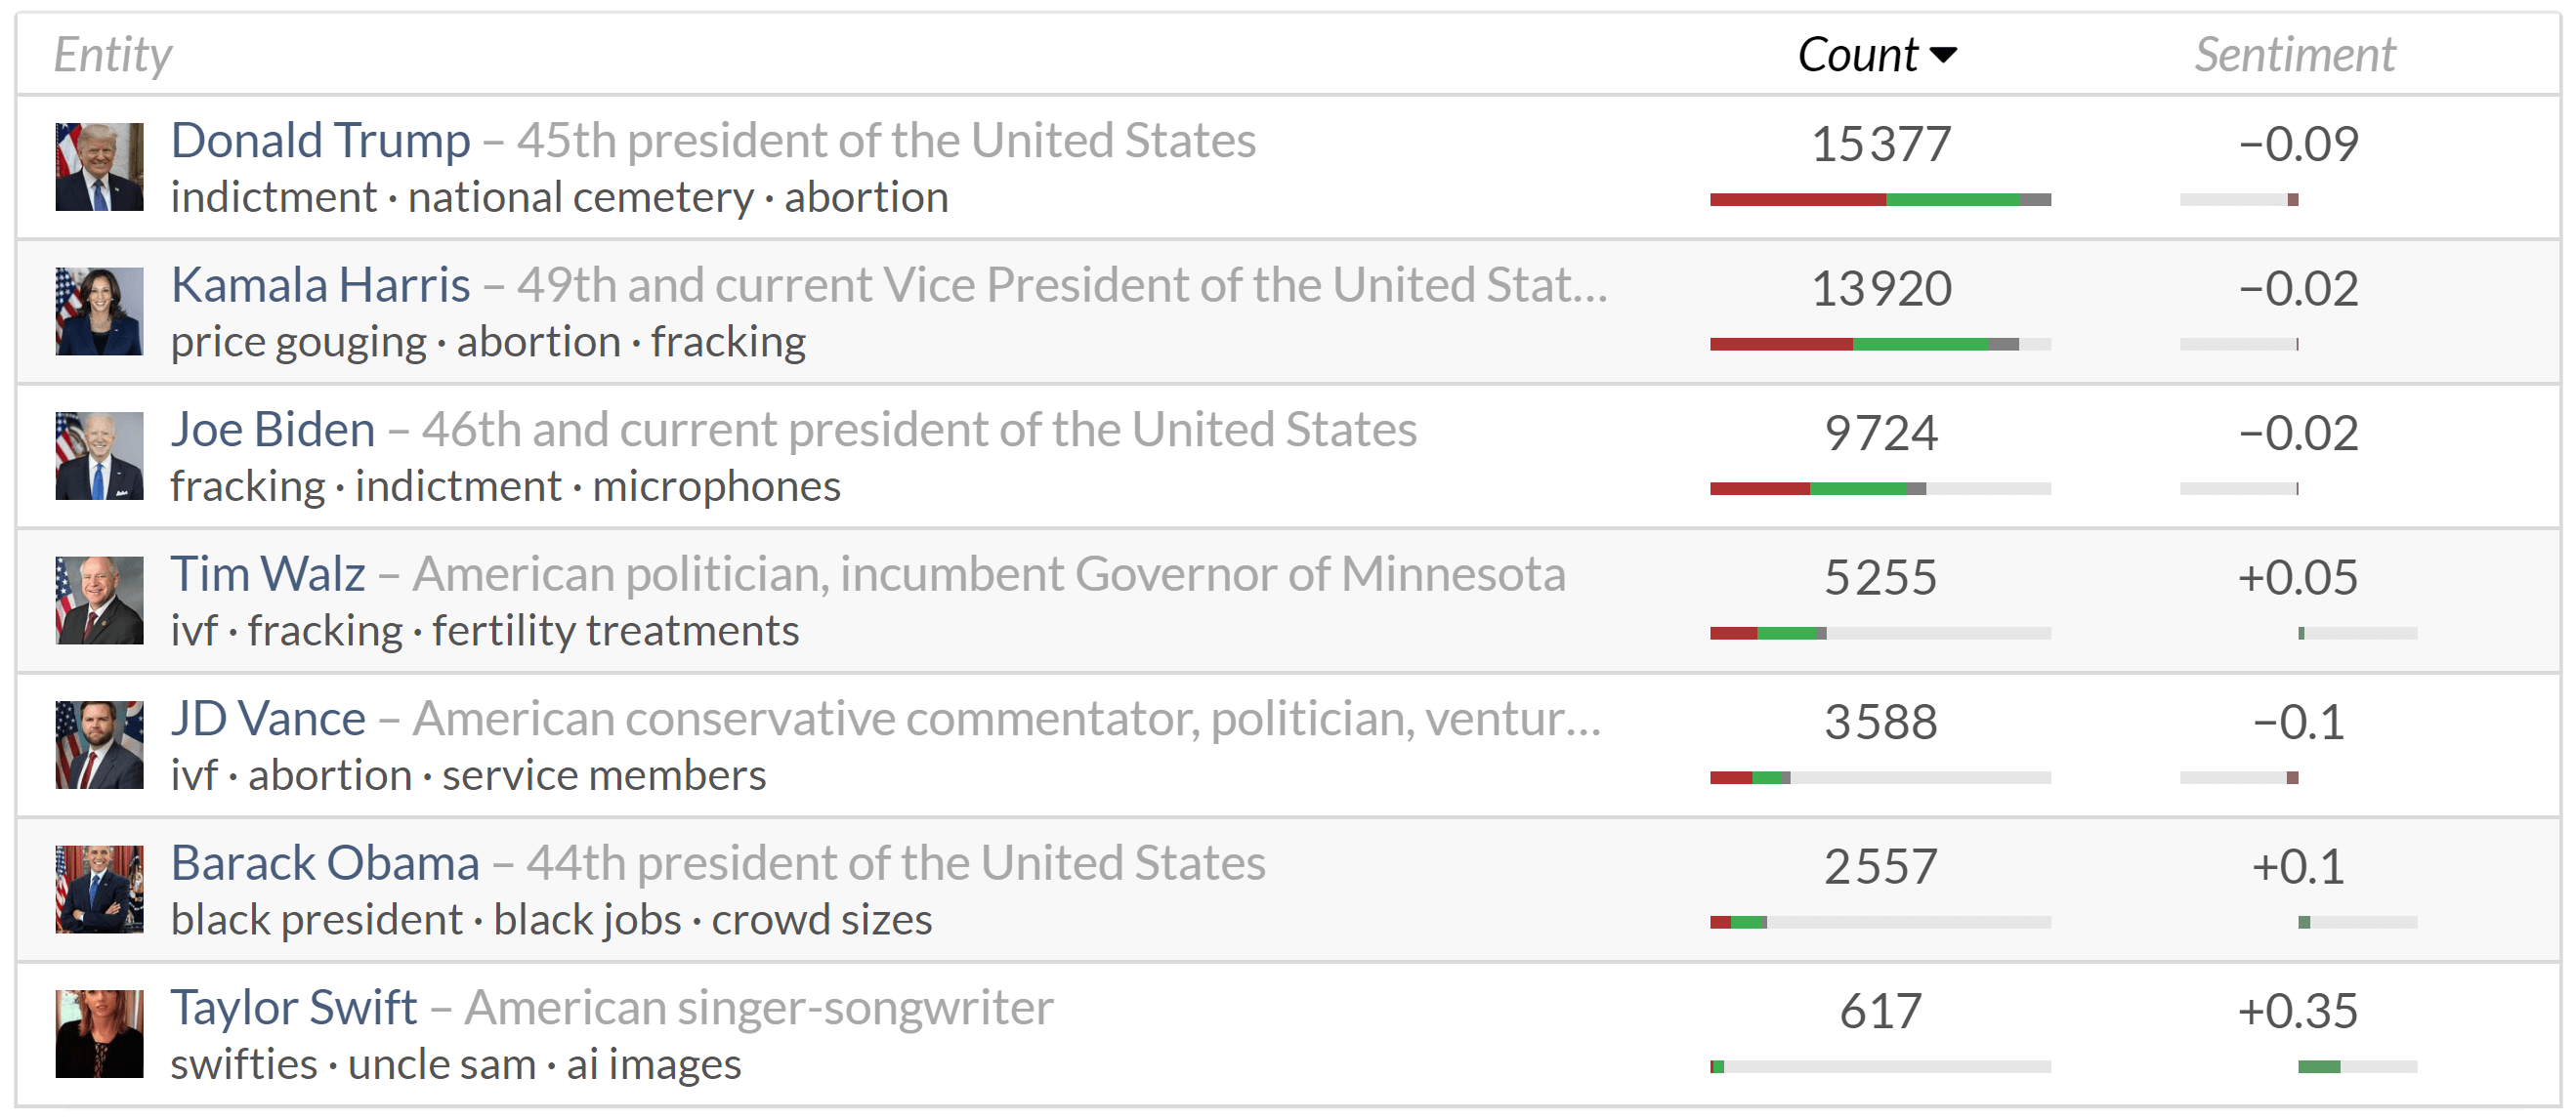
About 60% of the collected articles mention multiple candidates and discuss their performance on the campaign trail, which is sometimes referred to as “horserace coverage”. The remaining 40% specifically report on just one of the candidates. The following table based on August 2024 data takes a closer look at these 40%, presenting opinion leaders mentioned in these articles, the top associations with them, the number of mentions as well as the average sentiment.
Classify Sustainability Coverage
While it is possible and encouraged for users to define their own search queries concerning the election, predefined searches in the form of “bookmarks” facilitate the classification by candidate, by party, and by relevance for each of the 17 United Nations’ Sustainable Development Goals (SDGs). The outcome of the US Presidential Election has an enormous global impact. While most of the coverage focuses on what happens on the campaign trail, domestic and international audiences also want to know where the candidates stand on environmental, social, and economic issues. And this is best illustrated by automatically classifying the coverage by UN-SDG.
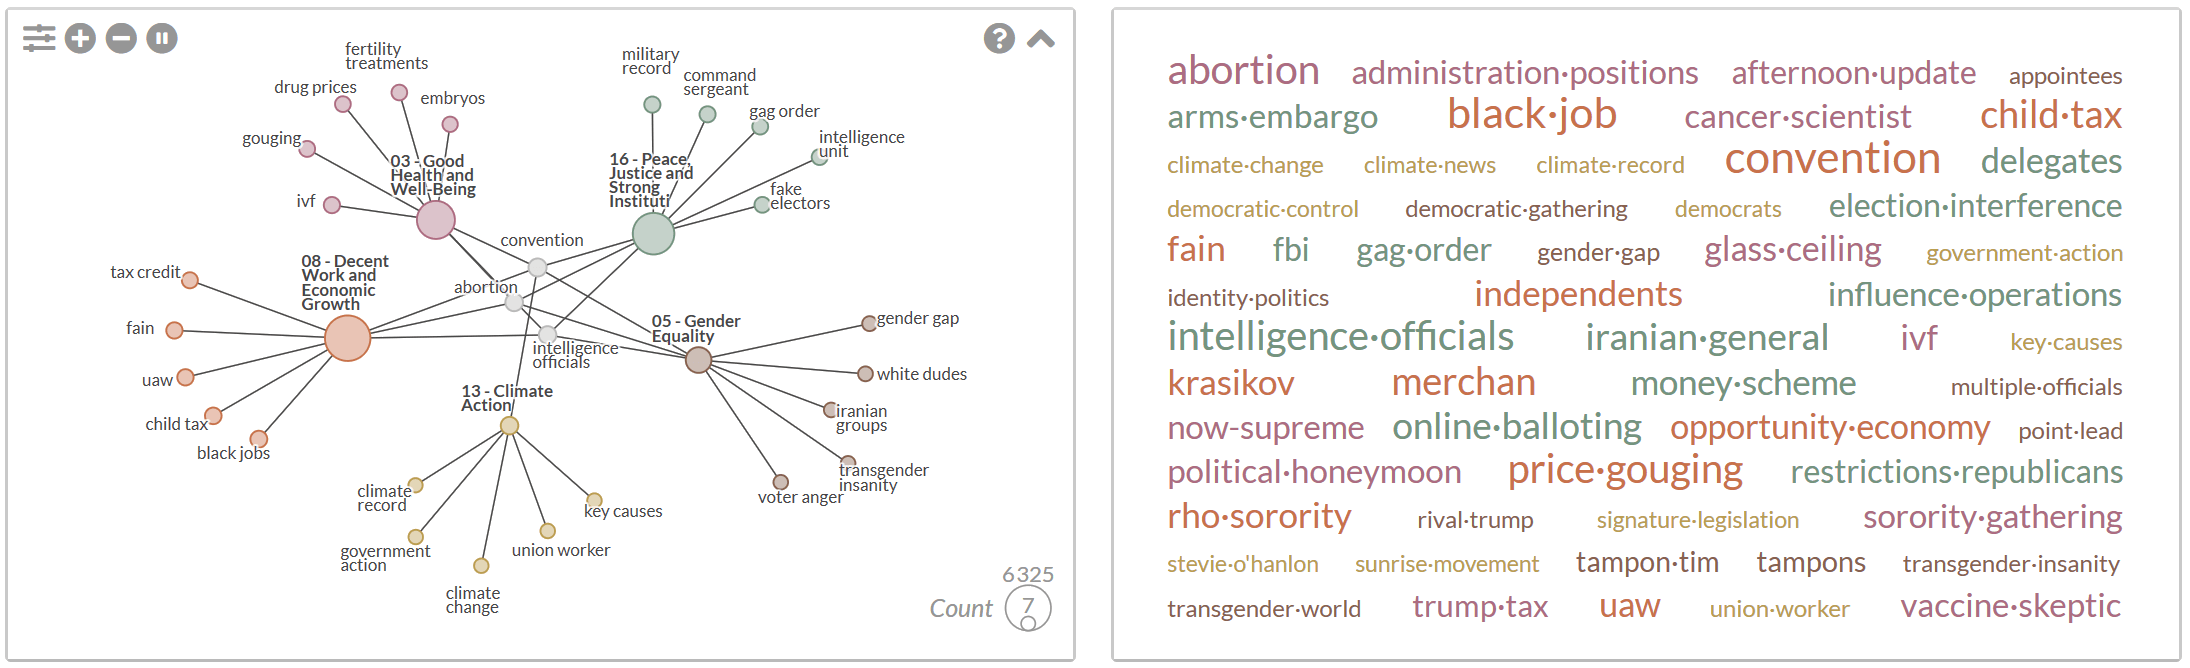
The keyword graph and tag cloud shown below illustrate these classification capabilities. They present an analysis of August 2024 coverage and use colors to distinguish the top keyword associations with SDG 3: Good Health and Well-Being (purple), SDG 5: Gender Equality (brown), SDG 8: Decent Work and Economic Growth (orange), SDG 16: Peace, Justice and Strong Institutions (green), and SDG 13: Climate Action (yellow).
International Research Collaboration
The US Election 2024 Web Monitor is jointly pursued by researchers from webLyzard technology and Modul Technology within the EU-funded TRANSMIXR project that advances visualization methods in immersive spaces to enable new narrative visions. Together with international media partners, they are currently building a technology showcase for IBC 2024, the International Broadcasting Convention that will draw more than 40,000 participants to Amsterdam in September 2024.
Austrian and EU research initiatives help continuously extend the underlying technologies and the capabilities of the visual dashboard. The provided fact-checking sample stems from the CHIST-ERA project CIMPLE, for example. The multilingual SDG classification component is a result of earlier work for UN Environment and the current SDGHUB initiative supported by the Austrian Ministry of Climate Action and Energy and the Austrian Research Promotion Agency.
Award-winning Technology Celebrates its 20th Anniversary
webLyzard published its first Election Monitor 20 years ago, when George W. Bush faced John Kerry in the 2004 presidential race (see this article published in the Journal of Information Technology and Politics). In 2008, an updated application for the US presidential election won the “Online Communities, Web 2.0 and Social Networks” category of the Austrian National Award for Multimedia and e-Business.
Eight years later, in June 2016, the US Embassy in Vienna organized a joint presentation of Prof. Hans Noel from Georgetown University and webLyzard’s Managing Director, Prof. Arno Scharl, to launch the US Election 2016 Web Monitor. The system was also featured in a TEDx talk on “Analyzing the Digital Talk: Visual Tools for Exploring Global Communication Flows” (see references below).


Analysis of the 2020 Election
In the years leading up to the 2020 Election, webLyzard continued to expand the underlying semantic search technologies and AI-driven knowledge extraction algorithms. The figures below show the results of a media analysis conducted between 23 Sep and 11 Nov 2020, including a trend chart that reflects the reaction of Twitter users to the election win of Joe Biden and Kamala Harris.


The analysis sheds light on the major stories emerging in conjunction with the Republican and Democratic campaigns, the top associations with each candidate, and a comparison of Twitter frequency and sentiment. It also reveals the significant impact of the TV debates between the presidential candidates and their running mates.
While the influence of social media is not new, in the 2016 and 2020 election cycles, the candidates’ social media posts have become key moments that shape the public debate for days and weeks. The social and economic impact of COVID-19, for example, eclipsed other issues of national or global importance. At the same time, events such as the White House coronavirus cluster, the partisan Supreme Court vote, or Donald Trump’s refusal to concede the election introduced additional uncertainties. Statements from both sides amplified these uncertainties and kept fueling the online discussions.
Try it now
So far, the 2024 campaign has proven at least equally as dynamic as the 2020 presidential race. It will be interesting to see how individual events shape global conversations as we approach the finish line.
Try out the dashboard at us2024.weblyzard.com
The dashboard is available in a Professional version, offering full customization and advanced analytics. The Lite version of the dashboard is a simple yet powerful content exploration tool perfect for mobile users. Depending on where you are browsing from, you may be taken directly to the Lite version. Have a look at our dashboard tutorials for additional information on how to best use the dashboard and which version is right for you.
In case of questions, send an email to election@weblyzard.com.
References
- Scharl, A. (2016). “Analyzing the Digital Talk: Visual Tools for Exploring Global Communication Flows“, TEDx talk at MODUL University Vienna in October 2016.
- Scharl, A. and Weichselbraun, A. (2008). “An Automated Approach to Investigating the Online Media Coverage of US Presidential Elections”, Journal of Information Technology & Politics, 5(1): 121-132.