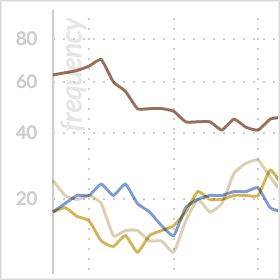
 https://www.weblyzard.com/data/sites/21/trend-chart-thumbnail.png 280 280 Arno Scharl https://www.weblyzard.com/data/sites/21/weblyzard-logo-2020.png Arno Scharl2020-10-18 09:00:362021-03-28 18:14:16Trend Chart – Dynamic Content Metrics
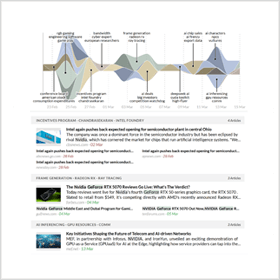 https://www.weblyzard.com/data/sites/21/weblyzard-streamgraph.png 280 280 Arno Scharl https://www.weblyzard.com/data/sites/21/weblyzard-logo-2020.png Arno Scharl2020-04-10 09:02:522025-03-19 09:05:25Story Detection and Story Graph Visualization
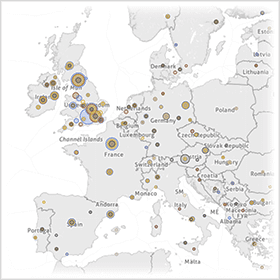 https://www.weblyzard.com/data/sites/21/geographic-maps-thumbnail.png 280 280 Arno Scharl https://www.weblyzard.com/data/sites/21/weblyzard-logo-2020.png Arno Scharl2019-10-18 11:15:432022-09-11 09:39:47Geographic Map – Geospatial Analytics
 https://www.weblyzard.com/data/sites/21/dashboard-configuration.png 280 280 Arno Scharl https://www.weblyzard.com/data/sites/21/weblyzard-logo-2020.png Arno Scharl2019-03-24 14:35:242021-05-03 21:39:36Dashboard Configuration
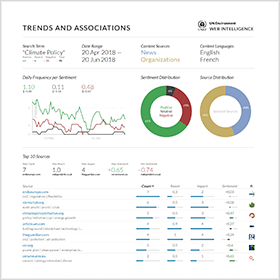 https://www.weblyzard.com/data/sites/21/pdf-report-generator-trends-sources.png 280 280 Arno Scharl https://www.weblyzard.com/data/sites/21/weblyzard-logo-2020.png Arno Scharl2018-06-16 15:27:202021-05-15 22:05:27PDF Report Generator
 https://www.weblyzard.com/data/sites/21/word-tree.png 180 180 Arno Scharl https://www.weblyzard.com/data/sites/21/weblyzard-logo-2020.png Arno Scharl2017-11-28 10:55:232025-01-06 06:35:33Word Tree – Keywords in Context
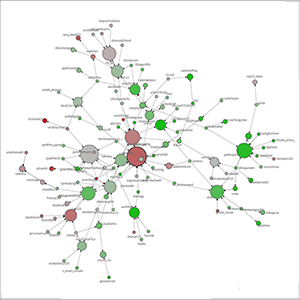 https://www.weblyzard.com/data/sites/21/sna-social-network-analysis-thumbnail.png 300 300 Arno Scharl https://www.weblyzard.com/data/sites/21/weblyzard-logo-2020.png Arno Scharl2015-12-12 23:59:102020-11-21 10:49:04Social Network Analysis (SNA)
 https://www.weblyzard.com/data/sites/21/brand-reputation-radar.png 180 180 Arno Scharl https://www.weblyzard.com/data/sites/21/weblyzard-logo-2020.png Arno Scharl2015-02-26 10:58:222020-11-20 21:39:10Brand Reputation Radar Chart
 https://www.weblyzard.com/data/sites/21/mobile-dashboard-thumbnail.png 280 280 Arno Scharl https://www.weblyzard.com/data/sites/21/weblyzard-logo-2020.png Arno Scharl2014-10-29 23:24:342020-11-21 10:19:21Mobile Dashboard Version for Smartphones and Tablets
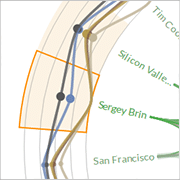 https://www.weblyzard.com/data/sites/21/entity-map.png 180 180 Arno Scharl https://www.weblyzard.com/data/sites/21/weblyzard-logo-2020.png Arno Scharl2014-07-29 22:06:072019-09-13 21:41:39Entity Map – Explore Content Relations
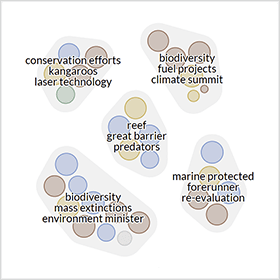 https://www.weblyzard.com/data/sites/21/cluster-map.png 280 280 Arno Scharl https://www.weblyzard.com/data/sites/21/weblyzard-logo-2020.png Arno Scharl2014-03-23 19:29:202025-01-06 06:17:36Cluster Map – Search Related Documents
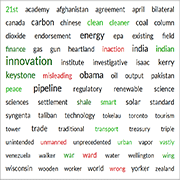 https://www.weblyzard.com/data/sites/21/adaptive-tag-cloud.png 180 180 Arno Scharl https://www.weblyzard.com/data/sites/21/weblyzard-logo-2020.png Arno Scharl2013-07-29 15:20:492021-05-03 21:58:54Tag Cloud – Keyword Associations
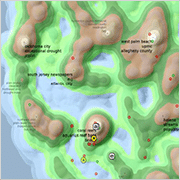 https://www.weblyzard.com/data/sites/21/info-landscape.png 180 180 Arno Scharl https://www.weblyzard.com/data/sites/21/weblyzard-logo-2020.png Arno Scharl2010-12-04 11:28:462022-09-11 09:32:16Information Landscape
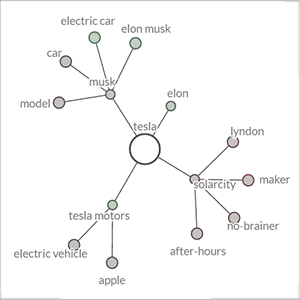 https://www.weblyzard.com/data/sites/21/keyword-graph-300.png 300 300 Arno Scharl https://www.weblyzard.com/data/sites/21/weblyzard-logo-2020.png Arno Scharl2010-12-02 16:31:242021-05-08 17:47:43Keyword Graph – Semantic Associations
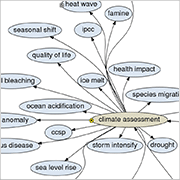 https://www.weblyzard.com/data/sites/21/ontology-graph.png 180 180 Arno Scharl https://www.weblyzard.com/data/sites/21/weblyzard-logo-2020.png Arno Scharl2009-12-04 11:39:312020-06-13 10:07:42Ontology Graph and Domain Model