Cross Media Analysis
Comparative analyses of patterns and trends across sources shed light on the editorial position of news media, and the diverging perceptions of e.g. corporations and social media users. The webLyzard cross media analysis package consists of three major components: source selector, source list and source map.
Source Selector
Enables users to retrieve and visualize information from specific stakeholders or media channels, using the “Content Source” menu of the main header to select and deselect sources at any time during the analysis.
Source List
Accessible via the sidebar menu of the search results window, this summary table lists term occurrences by source. The table offers an aggregated view that groups the results by source category (e.g. news versus social media), and a detailed view to compare Web sites such as Forbes or the Guardian, or individual social media accounts.  The Source List helps identify the most critical and positive voices. It also yields source-specific keywords that reflect what each source associates with the query term. The list can be sorted by name, frequency of mentions (count), reach based on a site’s average traffic rank, impact (frequency multiplied by reach), or average sentiment.
Source Map
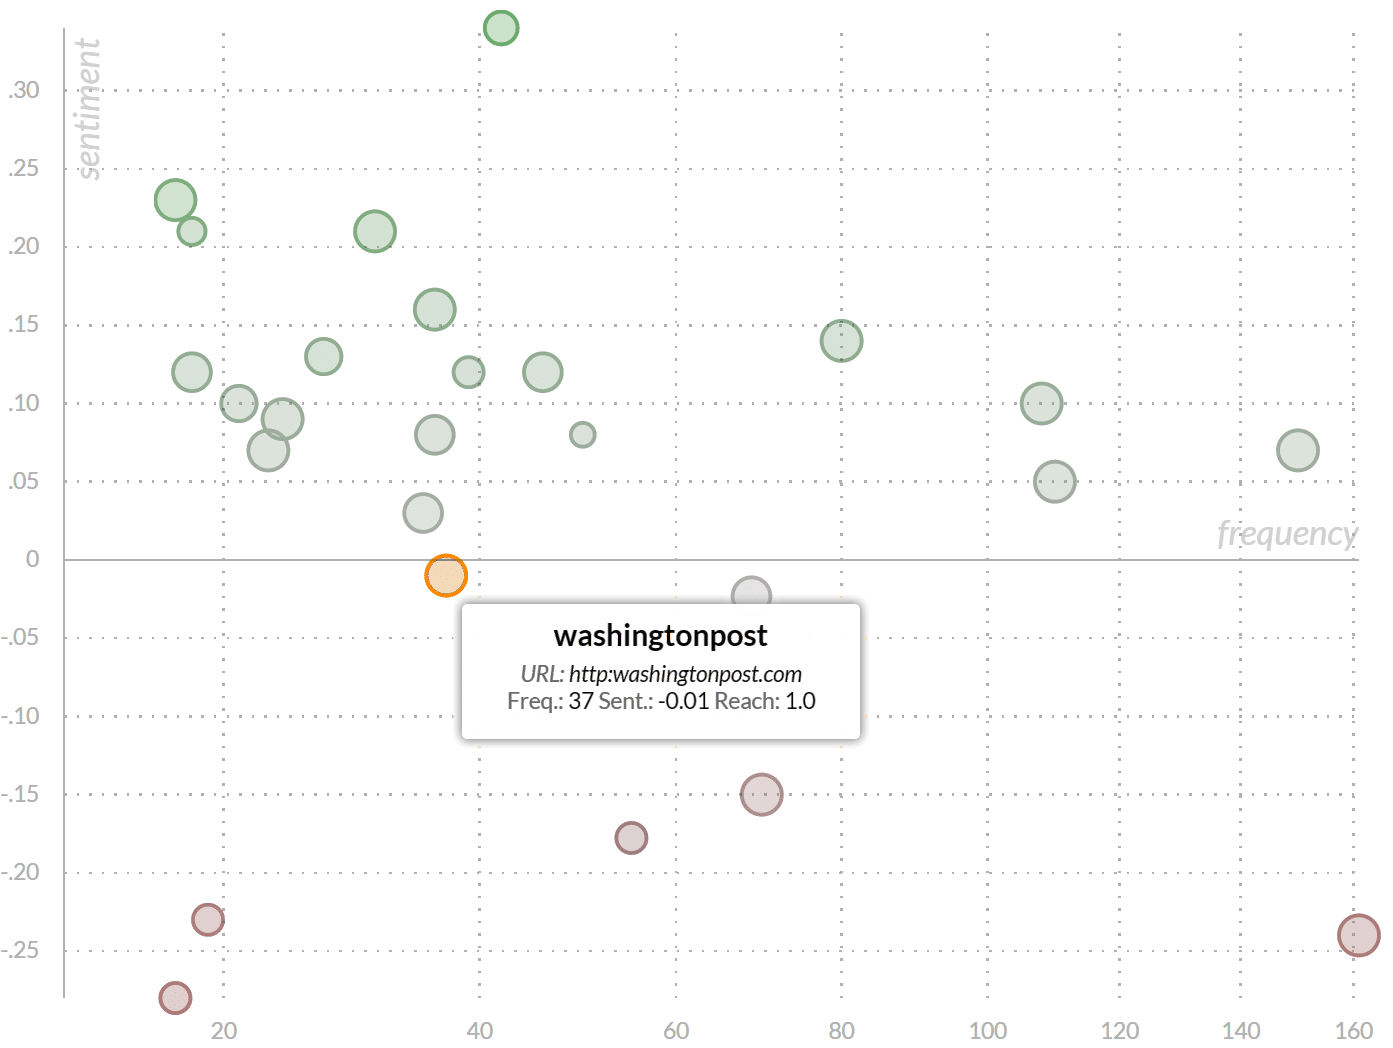
This interactive scatter plot translates the Source List into a visual cross media analysis. It shows the relative importance of a given topic, and the editorial position of the various sources towards this topic. The data points of the scatter plot reflect the following source characteristics:
- topic frequency (horizontal axis),
- average sentiment towards the topic (vertical axis, color-coding), and
- reach of the source (size of the marker).
Data point labels can be activated via the sidebar menu on the left. Whenever a user triggers a new search, animated transitions show the resulting changes in the data point distribution. 


